Explainer
Weighted slot symbols: why counting icons does not reveal odds
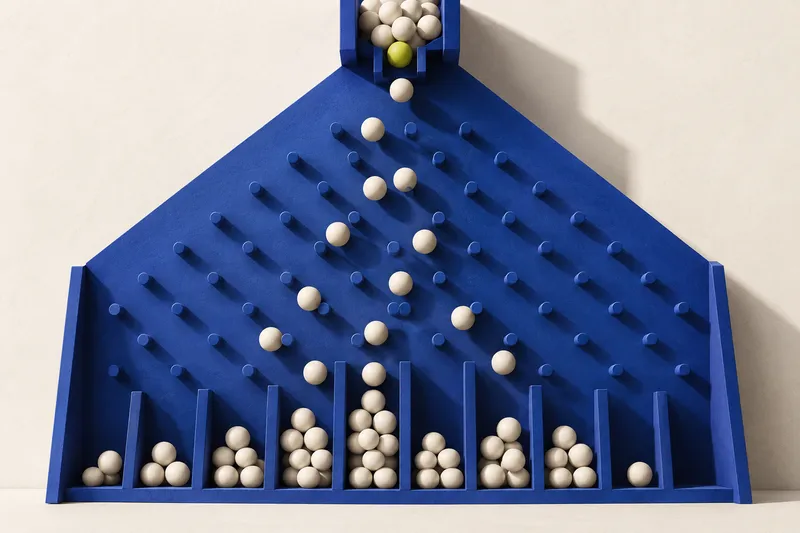
The short answer
Random inputs and displayed symbols are different layers. Several input values can map to one symbol. Counting the types of icons on a screen therefore does not establish their probabilities.
In this article
A display contains three types of symbol. It is tempting to assign each a one-in-three probability. That calculation is valid only if the selection process gives each type an equal share. The number of names or pictures in the interface does not tell us how outcomes are selected.
Ten equally likely numbers, three unequal symbols
Consider an original teaching model that draws one integer from 0 through 9, with each number equally likely. The software then looks up a symbol in a fixed mapping. There are ten possible inputs but only three kinds of visible output.
Illustrative example
| Random input | Displayed symbol | Share of inputs |
|---|---|---|
| 0–5 | Circle | 6 of 10 = 60% |
| 6–8 | Triangle | 3 of 10 = 30% |
| 9 | Star | 1 of 10 = 10% |
The input remains uniform: every integer has a 10% probability. The displayed result is non-uniform because the lookup assigns six integers to a circle, three to a triangle and one to a star. Unequal symbol frequencies are compatible with an evenly distributed random input. They are not, by themselves, evidence that the input generator is malfunctioning.
Section 3.2.3 of GLI-11 v3.0 distinguishes RNG selection from an intended non-uniform final distribution. We use that dated standard to explain the distinction, not to certify any product or describe every slot architecture.
Why combinations require more information
If three separate draws in this model are independent and use the same mapping, three stars have probability 0.10 × 0.10 × 0.10 = 0.001, or 0.1%. Three circles have probability 0.60 × 0.60 × 0.60 = 0.216, or 21.6%. Simply seeing three symbol types would not justify treating those combinations alike.
The multiplication relies on the stated independence assumption. It cannot be carried over automatically to a game with different mappings, dependencies, replacement rules or feature states. A screenshot supplies none of those details. The separate guide to independent outcomes explains why the assumption matters.
A reel image is not a probability specification
A visible reel arrangement can document what was displayed at one moment. It does not necessarily expose every possible state or its frequency. To analyze a specific implementation, a reviewer would need the relevant mathematical specification and enough information about how inputs become outcomes. Artwork alone is insufficient.
- Identify whether the source describes inputs, reel positions or final symbols.
- Check whether all listed possibilities are equally likely.
- Keep base-game and feature-state rules separate.
- State any independence assumption beside a combination calculation.
What can be concluded from a small sample?
Seeing more circles than stars would be unsurprising in our mapping, but a sample need not match 60/30/10 exactly. Frequencies describe observations; probabilities describe the model. A short recording can show which outcomes occurred and how they were presented. It cannot uniquely recover the complete mapping or distinguish all models that could have produced those outcomes.